New Delhi, 29 April 2025 – The air quality in the national capital continues to be a major public health concern, as multiple monitoring stations across Delhi report AQI levels ranging from ‘Poor’ to ‘Very Poor.’ According to the latest data, localities such as Mundka and Wazirpur have recorded particularly distressing AQI figures, with levels reaching as high as 338.
Current AQI Breakdown by Region
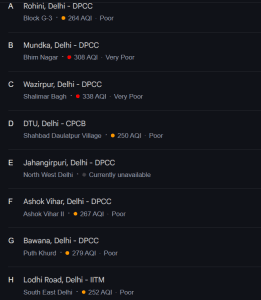
| Location | Monitoring Station | AQI Level | Category |
|---|---|---|---|
| Wazirpur, Shalimar Bagh | DPCC | 338 | Very Poor |
| Mundka, Bhim Nagar | DPCC | 308 | Very Poor |
| Bawana, Puth Khurd | DPCC | 279 | Poor |
| Ashok Vihar II | DPCC | 267 | Poor |
| Rohini, Block G-3 | DPCC | 264 | Poor |
| Lodhi Road, South East | IITM | 252 | Poor |
| DTU, Shahbad Daulatpur | CPCB | 250 | Poor |
| Jahangirpuri, North West | DPCC | N/A | Data Unavailable |
1. Wazirpur, Shalimar Bagh (AQI: 338 – Very Poor)
Monitoring Agency: DPCC
Remarks:
Wazirpur, a known industrial zone in North Delhi, houses numerous small-scale manufacturing units, especially in metal and plastics. Continuous emissions from these units, along with vehicular congestion on Ring Road and Grand Trunk Road nearby, have contributed to hazardous air quality. The area has consistently reported some of the worst AQI levels in Delhi due to unchecked industrial discharge and poor dispersion conditions.
Health Risk: Likely to cause respiratory distress even in healthy individuals; extremely unsafe for vulnerable populations.
🟥 2. Mundka, Bhim Nagar (AQI: 308 – Very Poor)
Monitoring Agency: DPCC
Remarks:
Mundka, located in West Delhi, is another industrial-residential hybrid zone, often impacted by emissions from factories, plastic recycling units, and heavy diesel vehicle traffic. Despite being part of the city’s outer ring, pollution control measures are not effectively enforced here. The lack of tree cover and close proximity of factories to residential units further intensify the pollution.
Health Risk: High; prolonged exposure may lead to chronic respiratory illnesses.
🟠 3. Bawana, Puth Khurd (AQI: 279 – Poor)
Monitoring Agency: DPCC
Remarks:
Bawana is home to Delhi’s largest industrial area, and though categorized as “Poor,” the reading of 279 is borderline “Very Poor.” Industrial chimneys, truck movement, and nearby landfill emissions drive the AQI upwards. Occasional waste burning and poor public transport accessibility force people to rely heavily on private vehicles, adding to the pollution.
Health Risk: Long-term exposure can lead to worsening of asthma and bronchitis.
🟠 4. Ashok Vihar II (AQI: 267 – Poor)
Monitoring Agency: DPCC
Remarks:
Ashok Vihar is a densely populated residential locality with commercial pockets. Air quality here is primarily degraded due to vehicular pollution, traffic bottlenecks, and seasonal construction. Proximity to Ring Road and the high number of diesel-run delivery vehicles passing through the area also contribute significantly to AQI levels.
Health Risk: Sensitive groups (children, elderly) may experience discomfort and irritation.
🟠 5. Rohini, Block G-3 (AQI: 264 – Poor)
Monitoring Agency: DPCC
Remarks:
Rohini, a large residential zone, continues to suffer from poor AQI due to its proximity to industrial belts in North-West Delhi and inadequate green buffers. Though local authorities have promoted tree plantations, high population density and increasing car ownership have outpaced these efforts.
Health Risk: Not immediately severe for healthy adults, but dangerous with continued exposure.
🟠 6. Lodhi Road, South East Delhi (AQI: 252 – Poor)
Monitoring Agency: IITM
Remarks:
Lodhi Road is surrounded by Lutyens’ Delhi, often seen as relatively greener. However, the increasing construction activity in nearby areas like Defence Colony, traffic from South Delhi arterial roads, and reduced wind speeds have led to the spike in AQI here. Lodhi Road’s AQI used to be in the moderate range in earlier Aprils, making this a concerning change.
Health Risk: Moderate to high risk; may affect people with pre-existing lung conditions.
🟠 7. DTU, Shahbad Daulatpur (AQI: 250 – Poor)
Monitoring Agency: CPCB
Remarks:
DTU is in the outskirts of North Delhi, where semi-urban sprawl and industrial units intersect. The nearby Narela and Bawana clusters influence air quality, and the absence of robust public transit options causes reliance on personal vehicles. Dust from unpaved roads and construction near university premises is also a contributor.
Health Risk: Persistent pollution may hamper students’ well-being and academic concentration.
⚫ 8. Jahangirpuri, North West Delhi (AQI: Data Unavailable)
Monitoring Agency: DPCC
Remarks:
While current AQI data is unavailable, Jahangirpuri has historically faced severe air quality issues due to its proximity to Azadpur Mandi (Asia’s largest wholesale market), heavy diesel truck traffic, and low ventilation. High-density living, along with waste management issues, exacerbates the air pollution burden here.
Health Risk (Based on trends): Likely in the “Poor” or worse category under typical circumstances.
🔁 Past vs. Present Trends
| Year | April Avg AQI (Wazirpur & Mundka) | Remarks |
|---|---|---|
| 2023 | ~210–230 | Relatively better due to tighter GRAP enforcement and cool weather |
| 2024 | ~240–250 | Pollution rose slightly post-COVID relaxation, but remained below 300 |
| 2025 | 308–338 | Sharp spike despite previous control measures; indicates system fatigue |
The current scenario paints a bleak picture and suggests that long-term interventions must now go beyond seasonal restrictions and shift towards structural urban reforms.
Comparison with Previous Years
Over the years, Delhi’s AQI readings have remained consistently troubling, but the current situation in late April 2025 indicates a stagnation or even worsening in some regions, especially when compared to 2023 and 2024 levels, which had shown mild improvement due to stricter enforcement of pollution control measures and favorable weather conditions.
-
April 2023: Average AQI in North-West Delhi hovered around 210–230 (lower range of ‘Poor’).
-
April 2024: Showed slight improvements post-COVID restrictions and clean fuel transitions; average AQI remained close to 200 in many regions.
-
April 2025: Readings have sharply spiked back to 250–338 in several zones, a reversal attributed to:
-
Increased vehicular traffic post-economic recovery.
-
Delayed implementation of green infrastructure projects.
-
A rise in dust emissions due to ongoing construction.
-
Health & Environmental Implications
Air pollution at these levels has severe implications:
-
Respiratory issues: Increased cases of asthma, bronchitis, and chronic lung diseases, especially among children and the elderly.
-
Mental health: Studies show prolonged exposure to poor air quality also affects cognitive performance and mood.
-
Economic impact: Estimated productivity loss due to pollution-linked illnesses exceeds ₹50,000 crore annually in Delhi alone.
Government Measures & Public Response
Despite several policies such as the Graded Response Action Plan (GRAP), promotion of electric vehicles (EVs), and smog towers, public experts argue that enforcement remains inconsistent.
Key steps being considered include:
-
Faster rollout of BS-VI compliant fuel across NCR.
-
Expansion of the Odd-Even vehicle scheme.
-
Installation of low-cost sensors in outer Delhi areas.
-
Mass awareness campaigns urging people to reduce outdoor activities and use air purifiers indoors.
Public Recommendations
The Central Pollution Control Board (CPCB) advises:
-
Use of N95 masks when outdoors.
-
Minimizing use of diesel generators.
-
Avoidance of early morning and late evening walks.
-
Supporting local green initiatives and plantation drives.
Conclusion
As Delhi grapples with another year of hazardous air, the time for reactive action is long past. A comprehensive and consistently enforced solution involving citizens, industries, and government alike is the only sustainable path forward. Without aggressive intervention, the capital may witness further environmental degradation in the months leading into summer and Diwali — typically the worst periods for AQI.
For real-time updates and detailed information on Delhi’s air quality, you can visit the Central Pollution Control Board’s official Air Quality Monitoring Dashboard:
👉 CPCB Air Quality Monitoring Dashboard
For more real time updates, visit Channel 6 Network.